

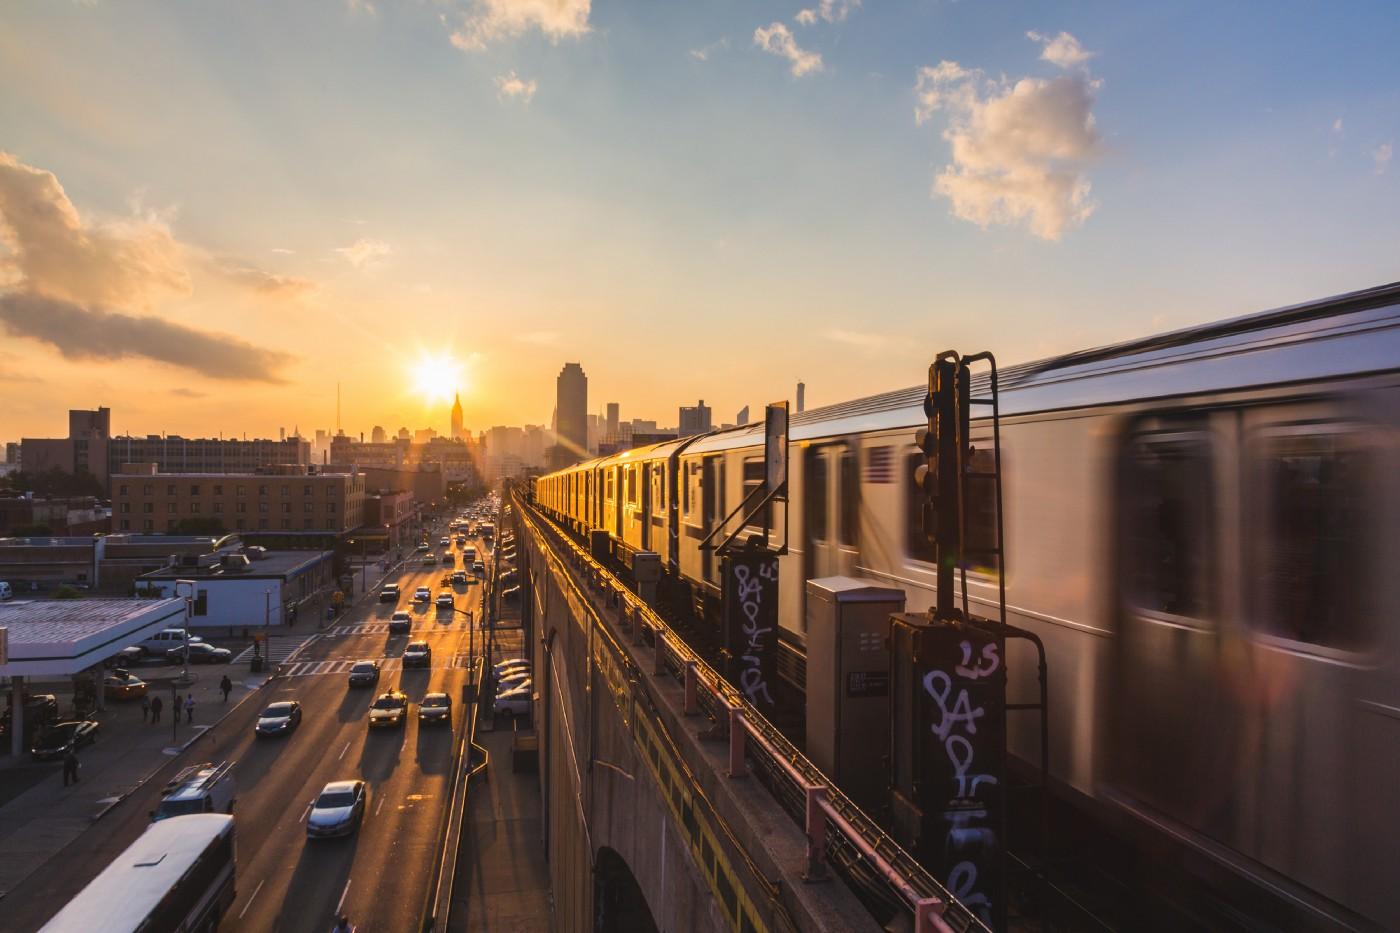
Human economies are built by the transportation system.
It’s like the vessels that carry blood through our bodies, says University of Texas community and regional planning associate professor Junfeng Jiao.
Just like physicians know the human structure, urban form scientists like Jiao know city structure: how buildings are formed, how densely packed they are, how tall or sprawling, what they’re used for — and the street networks that connect them.
So when COVID-19 began actually infecting bodies around the globe earlier this year, Jiao decided to look at the transportation system as a way to predict the virus’ spread.
Last month, he and two research associates in UT’s Urban Information Lab began gathering commuter train and highway traffic data from across New York state to determine where the virus would strike next.
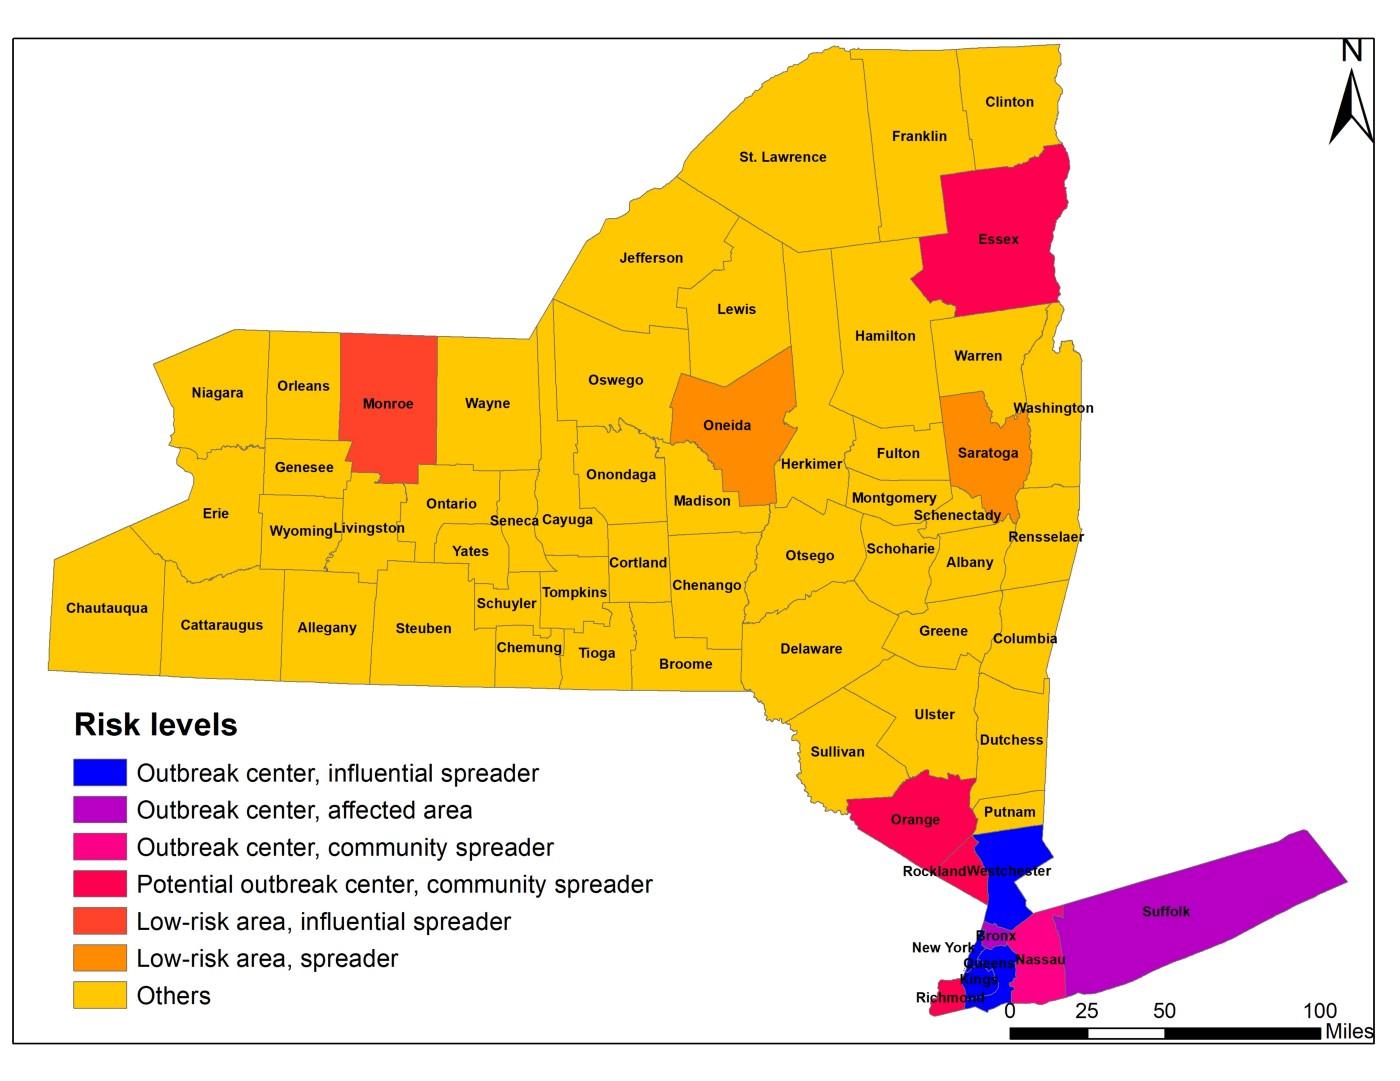
They started by ranking the severity of disease spread in each of New York’s 62 counties, using the numbers of confirmed cases and deaths and comparing them with population density. It was immediately clear which area would be the hardest hit first: greater New York City.
They then created a giant network model using train and highway trips both within and between counties to forecast the state’s next hot spots: in Monroe, Saratoga, and Oneida counties, farther upstate.
“These three counties are not as severely affected as New York City but have the potential to become the next outbreak centers because of their strong transportation connection to their neighboring counties,” Jiao says of the determination, which is featured in a draft paper expected to be peer-reviewed next month. “The government should allocate additional PPE and medical devices to these three counties because of the risk.”
It is this kind of resource allocation that makes staying ahead of the virus so important, says Jiao. The information could also help government leaders decide whether to cut off transportation between at-risk areas, he adds.
“Knowing where the problem is going to be is just as important as knowing the current situation.”
Looking at New York state is just the beginning, though; Jiao’s model can be duplicated for other parts of the United States. He and his team plan to look at Texas next.
Aside from teaching students about community and regional planning and its intersection with health, Jiao serves as faculty chair-elect of UT’s Good Systems grand challenge. The initiative brings together researchers from different disciplines to figure out how to make artificial intelligence technologies that benefit and protect society.
As part of the initiative, Jiao has been leading a project to map people’s risks for certain health conditions like asthma and obesity in Texas’s major metro centers using crowd-sourced data from 311 calls. While he is still working on that effort, Jiao decided last month to shift his focus specifically to COVID-19-related projects for the time being.
“If I were a medical professional, I would probably volunteer myself in a hospital,” he says from his home in Austin by Zoom call. “As an urban informatics scientist, I feel like it’s my duty to do something to help in this pandemic.”
It’s not surprising then that Jiao and his fellow Urban Information Lab researchers have been working on a second project that will determine people’s risk of acquiring COVID-19 based on the degree of social distancing happening where they live.
To do this, they’re relying on figures released by Safegraph, a for-profit data repository, that includes 6.1 million “points of interest” in the United States like bars, restaurants, and coffee shops where people often gather.
Safegraph also uses cell phone data to calculate the weekly travel patterns around each location, aggregating it based on census block group. This reveals the amount of social distancing happening (or not) in individual neighborhoods all across the country.
Jiao says they are using the weekly Safegraph data to build an algorithm that will “learn” and predict people’s daily travel patterns, starting in Texas then expanding to the entire country. The more movement, he says, the more likely people are to contract COVID-19.
“Knowing where the problem is going to be is just as important as knowing the current situation.”
In fact, his team has already begun building a website showing social distancing levels across Texas over time.
Jiao hopes that with this information, cities and counties will be able to make better decisions about shelter-in-place orders and resource allocation, as well as predict potential outbreaks before they happen.
“If we consider both the level of social distancing and number of confirmed cases in each neighborhood or ZIP code, then we can measure the actual risk to the disease,” he explains.
Jiao also recently wrapped up another COVID-related project, which analyzed the virus’s effects on the transportation system itself. That study found that vehicle traffic across the United States has dropped 39% since the start of the pandemic, leading to major changes in city landscapes, air quality, and gas emissions. Reductions were even greater in Texas’s major metro areas, where vehicle traffic dropped 75%.
“Animals have begun to roam city streets, gas emissions have plummeted, and the air is cleaner than it has been in years,” researchers wrote of their findings. “While the reduction in industrial activity has played a key role, we know the primary reason is a sharp decrease in vehicle usage.”
Another study Jiao has planned will look at how various neighborhoods are affected by the disease based on their level of social equity, or the services they receive.
“This outbreak happened,” Jiao says. “We felt we should do something.”